Calf Circumference Measurement Protocols for Sarcopenia Screening: Differences in Agreement, Convergent Validity and Diagnostic Performance
Article information

Abstract
Background
Although recommended by the Asian Working Group for Sarcopenia 2019 consensus (AWGS’19) as a screening tool for sarcopenia, there remains no consensus regarding the position (sitting, standing) or laterality (right, left) for the measurement of calf circumference (CC). This study aimed to determine the agreement between CC measurements, correlations with muscle mass and function, and diagnostic performance for sarcopenia screening.
Methods
We studied 176 healthy community-dwelling older adults (mean age, 66.8±7.1 years) from the GERILABS-2 study. CC was measured using non-elastic tape in four ways: left and right sides in the sitting and standing positions. Sarcopenia was diagnosed using the AWGS’19 criteria. We produced Bland-Altman plots to assess the agreement, partial correlations for muscle mass and function to compare convergent validity, and area under the receiver operating characteristic curve (AUC) to compare diagnostic performance.
Results
The prevalence rate of sarcopenia was 17.4%. Sitting CC was larger than standing regardless of laterality (right 35.31±2.95 cm vs. 34.61±2.74 cm; left 35.37±2.96 cm vs. 34.70±2.83 cm; both p<0.001), consistent with the systematic bias on Bland-Altman plots showing the overestimation of sitting over standing measurements (right bias=0.70 cm; 95% confidence interval [CI], -0.48–1.88; left bias=0.67 cm, 95% CI, -0.35–1.68). After adjusting for age and sex, CC was significantly correlated with appendicular skeletal mass, hand grip strength, knee extension, gait speed, chair stand, and short physical performance battery. Although right-sided CC measurements had better diagnostic performance (AUC=0.817), the difference was not statistically significant compared to the other positions (p>0.05). The optimal cutoff was <34 cm for all measurements, except for the left standing position (cutoff <35 cm).
Conclusion
Standing CC measurements are recommended for sarcopenia screening in community-dwelling older adults because of their good agreement without systematic bias, convergent validity, and diagnostic performance.
INTRODUCTION
Sarcopenia is a geriatric syndrome characterized by age-related loss of muscle mass, impaired muscle strength, and physical performance.1) Sarcopenia is highly prevalent, especially in older men, and results in an increased risk of frailty and negative outcomes including disability, falls, and mortality.2) Given the implications for disease burden and public health, early detection by screening for individuals at risk in the community or primary care setting is a priority.3) Calf circumference (CC) is recognized by the Asian Working Group for Sarcopenia 2019 consensus (AWGS’19)1) and the World Health Organization4) as a marker of muscle mass in older adult individuals. The results from different studies support the utility of CC as a surrogate marker for muscle mass measurement.5-8) CC shows a good correlation with measurements of skeletal muscle mass using dual-energy X-ray absorptiometry (DXA) and bioelectrical impedance analysis (BIA)6) and moderate to high sensitivity and specificity in predicting sarcopenia.5,7,8) In addition, CC predicts the disability risk in older adults.9) Unsurprisingly, the AWGS’19 recommended CC as a screening tool for sarcopenia in the community setting.6,8,10)
At present, there is wide variation in how CC is measured for sarcopenia screening due to the heterogeneity in measurement protocols. While the AWGS’19 recommends measuring the maximum value of both calves using a non-elastic tape, it offers no specific guidance on the position (standing vs. sitting) and laterality (left vs. right) for measurement. In terms of position, several studies10-13) have used the sitting position, similar to the Mini Nutritional Assessment (MNA) protocol, to assess the risk of malnutrition,14-16) albeit using higher cut-offs than the MNA for sarcopenia screening. Other studies have used the standing position,6,7,17) consistent with recommendations from the International Society for the Advancement of Kinanthropometry (ISAK).18) While there is a consensus to measure CC at the widest part of the calf, there is less guidance in terms of laterality. Some studies specifically measured the non-dominant calf,11,12) while others used the average calf measurements6,7) or the maximum value of both calves according to the AWGS'19 recommendations.5,13,19)
Thus, there is currently a lack of agreement regarding the position (standing or sitting) and laterality (right or left) in CC measurement protocols for sarcopenia screening. It is unclear whether the lack of standardization in measurement protocols leads to systematic differences that can affect the reliability and validity of the readings. Currently, there is a paucity of studies directly comparing different CC measurement protocols. A recent Korean study reported a larger area under the curve in receiver operating characteristic analysis for CC measurements in the standing position compared to sitting for sarcopenia diagnosis.19) The authors concluded that CC measurement on either side in the standing posture, regardless of the dominant hand, was an optimal method for screening for sarcopenia among community-dwelling older adults. However, the study did not compare the agreement or construct validity between the different CC measurement protocols.
As CC measurement is a simple and easy-to-use tool that can serve as a proxy for expensive and non-accessible diagnostic imaging modalities to assess muscle mass, knowledge of the ideal protocol to measure CC is essential for standardized measurements to ensure the reliability and accuracy of sarcopenia screening. Therefore, the primary aim of the present study was to determine the agreement between four different CC measurements (right standing, right sitting, left standing, and left sitting). The secondary aims were to compare the convergent validity via correlation with muscle mass and function and the diagnostic performance for sarcopenia screening among healthy community-dwelling older adults.
MATERIALS AND METHODS
Study Population
This cross-sectional study included 176 participants from the “Longitudinal Assessment of Biomarkers for characterization of early Sarcopenia and Osteosarcopenic Obesity in predicting frailty and functional decline in community-dwelling Asian older adults Study” (Geri-LABS-2). The details of this study were described previously.20) In brief, the Geri-LABS-2 is a prospective cohort study with an annual follow-up of 230 healthy community-dwelling older adults aged 50–99 years who are functionally independent in both basic and instrumental activities of daily living (bADL and iADL), have no history of dementia or cognitive impairment (modified Chinese Mini-Mental State Examination [mCMMSE] score <21),21) and can walk 8 m independently. For the study duration (between September 1, 2020, and April 30, 2021), we contacted 211 participants for a second follow-up visit, of which 35 (16.6%) declined. Thus, our study comprised 176 (83.4%) participants who completed the assessments during the second follow-up visit. Written informed consent was obtained from the participants in the presence of a trained research assistant. This study was approved by the Institutional Review Board of the National Healthcare Group (No. NHG DSRB 2017/00850).
Also, this study complied with the ethical guidelines for authorship and publishing in the Annals of Geriatric Medicine and Research.22)
Data Collection
We collected baseline demographic information, including age, sex, ethnicity, and cardiovascular risk factors (hypertension, hyperlipidemia, diabetes, ischemic heart disease, atrial fibrillation, stroke or transient ischemic attack, and smoking). Anthropometric measurements, including weight, height, body mass index (BMI), and CC, were recorded. We assessed cognition using the locally validated mCMMSE,21) mood using the 15-item Geriatric Depression Scale (GDS),23) and nutritional status using the MNA.14-16) Functional status was assessed using the Modified Barthel Index (MBI)24) for bADL, Lawton and Brody’s Index for iADL,25) and the Frenchay Activities Index for everyday activities.26) Frailty and sarcopenia were assessed using FRAIL27) and SARC-F,28) respectively.
We measured relative appendicular skeletal mass (ALM) using multi-frequency bioimpedance analysis (InBody 770; InBody, Seoul, Korea). Fat-free lean body mass in the four limbs was summed and standardized using the square of the height to obtain the relative appendicular skeletal mass. Muscle function was assessed based on muscle strength and physical performance. For muscle strength, we measured the maximum hand grip strength using a hydraulic hand dynamometer (North Coast Medical Inc., Gilroy, CA, USA) and knee extension strength using an electronic push/pull dynamometer (BASELINE 12-0342; Fabrication Enterprises Inc., White Plains, NY, USA).29) For physical performance, we assessed the usual gait speed based on the time taken to walk 3 m and also measured the time taken to perform five chair stands with a sitting stop. The Short Physical Performance Battery (SPPB),30) a three-component test comprising balance, gait speed, and repeated chair stands, was administered as a gauge of overall physical performance. Sarcopenia was defined using the AWGS’19 criteria as follows: (1) low muscle mass (<7.0 kg/m2 in male and <5.7 kg/m2 in female); along with (2) low handgrip strength (<28 kg in male and <18 kg in female) and/or slow usual gait speed (<1.0 m/s).1)
Calf Circumference Measurement
We conducted four CC measurements: right-standing, right-sitting, left-standing, and left-sitting. Three trained research assistants performed the CC measurements in a standardized manner. The widest part of the calf was measured using a non-elastic tape. The tape was snugly applied flat on the skin and parallel to the floor in, taking care not to compress the calf. Sitting CC was first measured with the knee and ankle bent at a right angle and the feet flat on the floor. Standing CC was then measured with the feet at a shoulder-width distance for equal distribution of body weight. Altogether, we obtained four readings: the left and right sides in the sitting and standing positions, respectively.
Statistical Analysis
Statistical analyses were performed using IBM SPSS Statistics for Windows, version 23.0 (IBM Corp., Armonk, NY, USA). Statistical tests were two-tailed, with the level of significance set at 5%. Quantitative or continuous variables are expressed as mean±standard deviation or median (interquartile range). Categorical variables are expressed as absolute and relative frequencies and percentages. We first performed paired t-tests to compare CC measurements according to position (standing and sitting) and laterality (right and left). We then constructed Bland-Altman plots to determine the agreement between the CC measurements. Systematic bias was calculated as the mean difference between the methods, and the 95% limits of agreement were calculated as the bias ±2 SD for the differences between the methods. To ascertain the construct validity of the different CC measurements, we determined the partial correlation with relative appendicular skeletal mass and muscle function, adjusted for age and sex.
To compare diagnostic performance, we generated receiver operating characteristic (ROC) curves against the AWGS’19 criteria for sarcopenia as the reference standard. The area under the ROC curves (AUCs) were compared using the DeLong method. We determined the optimal cut-off value using the Youden method and derived the corresponding sensitivity, specificity, positive predictive value, and negative predictive value (NPV). We then performed a sex-stratified analysis to obtain the corresponding values for male and female.
We used MedCalc for Windows, version 21.111 (MedCalc Software, Ostend, Belgium) to calculate the sample size based on the evaluation of the Bland-Altman plot between sitting and standing CC measurements. We estimated that a sample size of 155 paired results would provide 80% power to detect a mean difference of 0.46±0.4 with a maximum allowed difference between methods of 1.4, at an alpha level of 0.05. This yielded a final sample size of 172 participants, to accommodate a dropout rate of 10%.
RESULTS
Baseline Characteristics
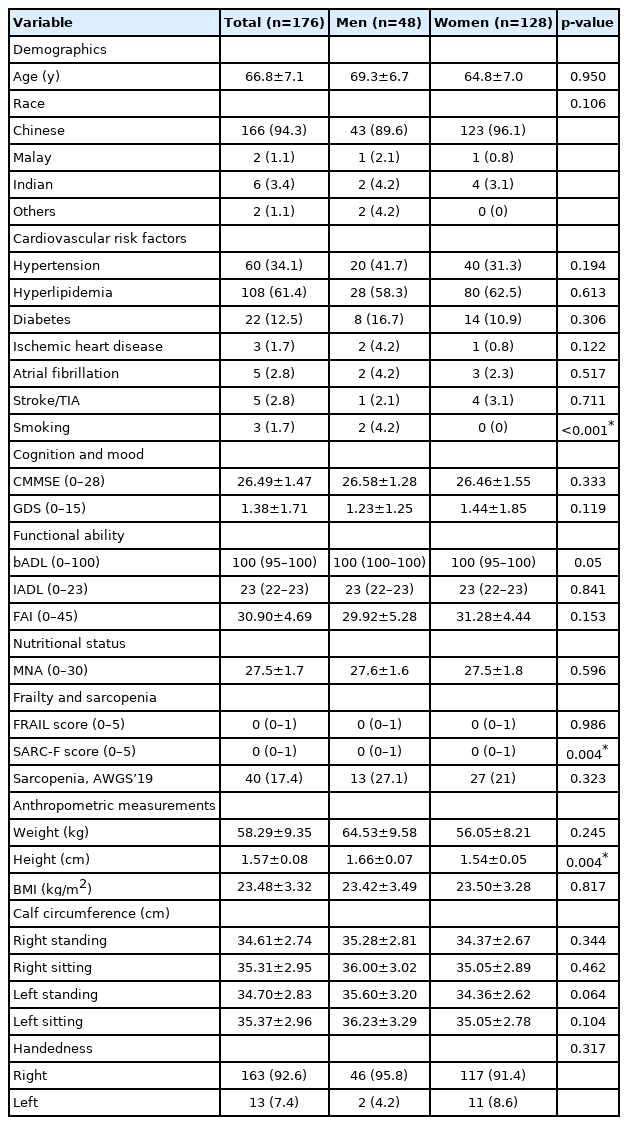
We studied 176 community-dwelling older adults with a mean age of 66.8±7.1 years (male, 69.3 years; female, 64.8 years) who were predominantly Chinese (94.3%) (Table 1). The most prevalent cardiovascular risk factors were hyperlipidemia (61.4%), hypertension (34.1%), and diabetes (12.5%). The participants were cognitively and functionally intact (CMMSE, 26.49±1.47; MBI, 100 (95–100); Lawton & Brody’s Index for iADLs: 23 (22–23), with no significant depressive symptoms (GDS, 1.38±1.71) or malnutrition (MNA, 27.5±1.7). The prevalence of sarcopenia was 17.4% based on the AWGS’19 criteria. The CC measurements ranged from 34.61 to 35.37 cm, with male having higher readings than female. Although most participants were right-handed (92.6%), the left CC measurements were higher than the right CC measurements, regardless of position.
General characteristics
Agreement between CC measurements
The sitting CC measurements were larger than the standing CC measurements regardless of laterality—right-sitting 35.31±2.95 cm vs. right-standing 34.61±2.74 cm (p<0.01); left-sitting 35.37±2.96 cm vs. left-standing 34.70±2.83 cm (p<0.01) (Table 2). For male, the right-standing CC was slightly smaller than the left-standing CC (35.28±2.81 cm vs. 35.60±3.20 cm; p=0.011). We observed no significant differences in CC measurements based on laterality in the standing position for female and the sitting position for both male and female.

Comparison between calf circumference measurements in different positions
Fig. 1A–1D show the Bland-Altman plots comparing the agreements between CC measurements in the standing and sitting positions. The agreement was affected by position (standing vs. sitting) on both sides. We observed a systematic bias, with an overestimation of CC values in sitting compared to standing positions for both sides—right-sitting vs. right-standing (bias=0.70 cm; 95% confidence interval [CI], -0.48–1.88); left-sitting vs. left-standing (bias=0.67 cm; 95% CI, -0.35–1.68). Conversely, we observed no evidence of systematic bias for right vs. left sides in both sitting and standing positions—right vs. left-standing (bias=-0.09 cm; 95% CI, -1.66–1.48); right vs. left-sitting (bias=-0.06 cm; 95% CI, -1.89–1.77).

Bland-Altman plots comparing the agreements between CC measurements in the standing and sitting positions. (A) Right sitting vs. right standing. (B) Left sitting vs. left standing. (C) Right standing vs. left standing. (D) Right sitting vs. left sitting.
Correlations of CC Measurements with Muscle Mass and Function
Table 3 shows the correlations of CC measurements with muscle mass and function. Adjusted for age and sex, CC showed significant correlations, including a good correlation for relative appendicular skeletal mass (r=0.640 to 0.677, p<0.05), a modest correlation for hand grip strength (r=0.317 to 0.346, p<0.01), and weak correlations for knee extension (r=0.204 to 0.236, p<0.01), gait speed (r=-0.048 to -0.078, p>0.05), chair-stand (r=0.161 to 0.194, p<0.05), and SPPB (r=-0.196 to -0.240, p<0.05).
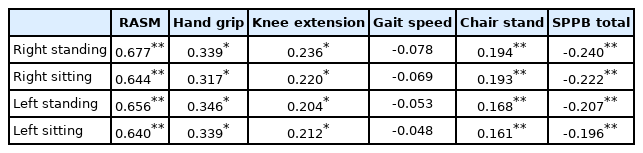
Correlation with muscle mass and function
Diagnostic Performance for Sarcopenia Screening
The diagnostic performance did not differ significantly between CC measurements in the standing and sitting positions (right AUC=0.817 vs. 0.816, p=0.904; left AUC=0.790 vs. 0.786, p=0.696) (Table 4). Similarly, although right-sided measurements had better diagnostic performance, the difference in AUCs was not significant (p>0.05). Standing CC measurements had higher sensitivity and NPV compared to sitting CC regardless of laterality (right sensitivity=85.0% vs. 75.0%, NPV=93.3% vs. 90.7%; left sensitivity=92.5% vs. 72.5%, NPV=96.0% vs. 89.5%). The optimal cutoff was <34 cm for all measurements, except for the left standing position (cutoff <35 cm). In sex-stratified analyses, the left-standing position had the highest AUC in male compared to the right-standing position in female. The optimal cut-off was <35 cm in all positions except right-standing (<34 cm) for male, whereas the optimal cut-off was <34 cm in all positions for female.

Diagnostic performance of CC measurements for sarcopenia screening
DISCUSSION
Despite being recommended by the AWGS’19 as a screening tool for community screening for sarcopenia, the methods for CC measurement vary widely. To our knowledge, this is the first study to directly compare different CC measurement protocols across the comprehensive domains of agreement, construct validity, and diagnostic performance for sarcopenia screening. Our results were based on an earlier comparative study by Jeong et al.,19) which highlighted the importance of measurement position (standing vs. sitting) in CC-based screening for sarcopenia in the community setting (Table 5). Our demonstration of the systematic overestimation of sitting measurements supports the use of standing CC protocols. This corroborates the AWGS’19 recommendations for sarcopenia screening and highlights the distinction from CC protocols for malnutrition detection (such as the MNA), which typically utilize the sitting position.14-16) Furthermore, comparisons of the four positions showed the highest correlation of right-standing CC measurement with muscle mass and function, as well as the best performance for sarcopenia diagnosis.

Comparison of key characteristics and findings of calf circumference measurement protocol studies
We demonstrated a systematic bias with the overestimation of CC by approximately 0.70 cm in the sitting position compared to the standing position, regardless of laterality. These findings were similar to those of an earlier study involving community-dwelling older adults in Korea19) and suggest that CC measurements are not interchangeable between positions. Such variations can be explained by the differential movement of blood and extracellular fluid with changes in external hydrostatic pressures from sitting to standing31) and altered length-tension relationships with increased muscle contraction while standing, thereby increasing the adhesion between muscle and superficial adipose tissue, resulting in standing smaller CC values compared to those in the sitting position.31) We postulate that the contraction of the gastrocnemius muscle, the largest muscle in the calf, which passes both the knee and the ankle joint, contributes to smaller CC readings in the standing position.
Therefore, standing and sitting CC measurements should not be used interchangeably, as sitting measurements may result in a consistent overestimation of CC values, which in turn leads to the under-detection of sarcopenia. This systematic bias is especially salient in borderline cases, where the measurement error arising from the measurement position of the CC can result in misclassification with consequent under-detection of cases. For instance, an older adult gentleman with a CC reading of 34.5 cm in the sitting position would be classified as non-sarcopenic (i.e., ≥34 cm), whereas in reality, the corresponding reading of 33.8 cm in the standing position should be classified as sarcopenia (i.e., <34 cm) according to the AWGS’2019 criteria.
The results of our study demonstrated significant correlations between CC and both muscle mass and function. This affirms the construct validity of CC measurements and supports the use of CC for sarcopenia screening according to the AWGS’19 recommendations.1) The good correlation with muscle mass was unsurprising and consistent with findings from earlier studies that supported the utility of CC as a surrogate for muscle mass measurement.5-8) Comparisons between positions showed the highest correlation between right-standing CC and knee extension strength and muscle function (i.e., gait speed, repeated chair stand, and SPPB), thus supporting its role as a possible surrogate gauge of lower limb strength and function. This is a germane finding, as muscle function has been consistently shown to be a more powerful predictor of clinically relevant outcomes than muscle mass per se.32)
The recommendation to use standing CC measurements for sarcopenia screening was further underscored by its superior diagnostic performance in the ROC curve analysis. This was mainly attributable to the superior sensitivity and negative predictive value, regardless of laterality, which resulted in better case detection of sarcopenia. In our study, right-standing CC showed the best diagnostic performance, although it was not statistically superior to the other positions. The optimal overall cut-off of <34 cm in the right standing position was comparable to the AWGS’19 criteria (<34 cm in male and <33 cm in female). Notably, the cut-offs for sarcopenia screening are higher than the corresponding cut-off of <31 cm for malnutrition in the MNA.14-16) The differences in cut-off values are indicative of the underlying construct being measured, with sarcopenia involving both muscle mass and function, whereas CC serves as a surrogate for muscle mass for malnutrition assessment.
This study had several limitations. This study was conducted in a predominantly Chinese Asian population that was cognitively and functionally intact. Thus, the results may not be generalizable to other ethnic groups or older adults with frailer health status. The cross-sectional design also limited definitive conclusions regarding causality; moreover, reverse causality cannot be excluded from the demonstrated associations. The small sample size, with most subjects being right-handed, as well as the absence of data on calf dominance, precluded further analyses to understand the influence of handedness on CC measurements at different positions. Similarly, the differences in the sex-stratified cutoff values for sarcopenia screening from our single-population study (<34–35 cm for male and <34 cm for female) compared to those proposed by AWGS’19 (<34 cm for male and <33 cm for female) may also be related to the small sample size and should be interpreted with caution. Thus, larger studies with longitudinal follow-up in other Asian populations are warranted to verify the superior diagnostic performance and construct validity for right-standing CC measurement. Lastly, although the mean age in our study was fairly comparable to that in previous validation studies in Asian populations,7,19) we included 26 participants (14.8%) aged 50–59 years, which is younger than the 60–65 years cutoff of the AWGS’2019 recommendations. Nonetheless, except for more female, the bADL, frailty status, nutrition, SPPB, and CC measurements did not differ significantly compared to those in participants aged ≥60 years. Sensitivity analysis excluding the <60 age group revealed similar results for the comparisons of CC measurements and diagnostic performance in different positions.
In conclusion, the results of this direct comparative study of four CC measurement protocols builds upon the body of evidence by demonstrating the importance of position (standing vs. sitting) when used for sarcopenia screening in a community setting. The standing position should be used owing to its good agreement without systematic bias, construct validity, and diagnostic performance. Although our results support that right standing CC measurement over the left standing position, this requires validation in future studies.
Notes
The authors thank the study participants who contributed to this study. We are also grateful to Audrey Yeo, Suzanne Yew, and Cai-Ning Tan for their invaluable assistance with data collection.
CONFLICT OF INTEREST
The researchers claim no conflicts of interest.
FUNDING
This study was supported by a Lee Foundation grant (2019).
AUTHOR CONTRIBUTIONS
Conceptualization, MRBP, SL, WSL; Funding acquisition, JC, JPL, WSL; Methodology, MRBP, SL, JC, JPL, NHI, YYD, WSL; Supervision, WSL; Writing-original draft, MRBP, SL; Writing-review & editing, MRBP, SL, JC, JPL, NHI, YYD, WSL.